Why Transit Crash Data Deserves Closer Attention
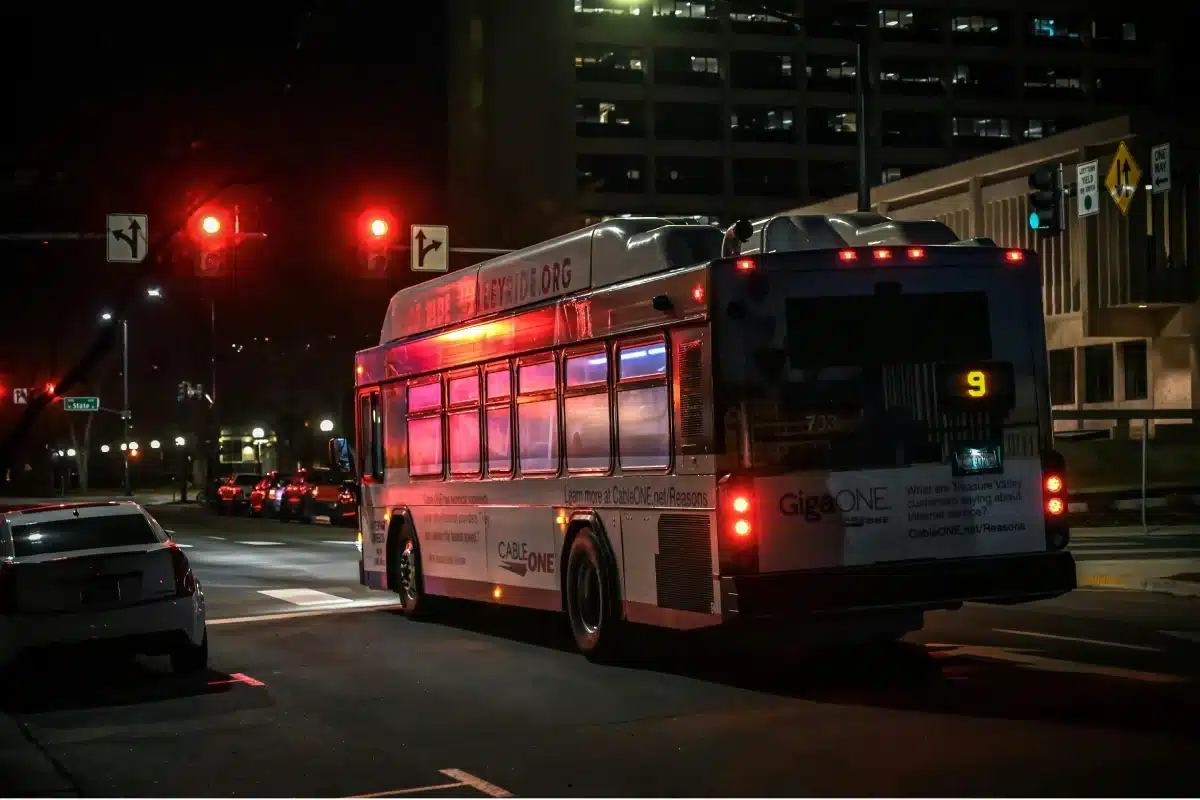
In dense urban environments where public transportation carries thousands of passengers daily, city buses are a constant presence in traffic. In Chicago in particular, the volume of transit vehicles operating across busy intersections, commercial corridors, and residential streets creates a demanding driving environment. Because of that scale, public transit crash reporting provides unusually detailed insight into how collisions occur and who is injured.
Bus crashes are rarely isolated events. The documentation often captures where impacts occur, the type of contact, and how injuries are recorded among passengers and other road users. For drivers of larger personal vehicles such as pickup trucks and SUVs, that level of detail is useful because it reflects real-world friction points: tight turns, frequent stops, limited sight lines, and heavy traffic compression.
Transit buses also operate differently from most vehicles around them. They stop on schedule, merge repeatedly, and maneuver long bodies through short city blocks. When incidents occur, they commonly trigger layered reporting, which helps produce a dataset that is a practical tool for understanding exposure and responsibility in shared-road situations.
A Closer Look at Crash Frequency and Injury Patterns
A data-driven analysis of Chicago bus accident statistics shows that bus-related crashes consistently cluster around predictable locations and movements. Intersections, curbside stops, and signal-controlled corridors repeatedly appear in reports because buses operate there at high frequencies, often while surrounding traffic struggles to keep pace.
Several collision types appear regularly in the data:
- Rear-end impacts are tied to frequent stopping and stop-and-go flow
- Intersection crashes where turning paths and right-of-way decisions collide
- Side contact events occur when vehicles misjudge the space near wide turns or lane boundaries
Injury reporting adds another layer. Even low-speed impacts can cause multiple injury entries because passengers may be standing, walking to their seats, or bracing during stops. For surrounding drivers, the risk profile differs but remains significant: the momentum of heavy vehicles can increase injury severity and property damage, particularly when a bus is involved in a multi-vehicle sequence.
Chain-reaction collisions also show up as a recurring feature in dense corridors. A sudden stop, a late brake, or a blocked lane can cascade into secondary impacts, increasing both the number of parties involved and the complexity of determining what occurred.
Common Collision Patterns and Who Is Typically Affected
Bus crash reporting often repeats the same narratives because bus operations follow the same routes throughout the day.
Intersection turning conflicts are a major issue. Buses require space to turn, and their path can extend into adjacent lanes. Vehicles that sit alongside a bus near a right turn are exposed to side contact when the lane narrows, and the bus completes its arc.
Stop-and-restart friction is another. Buses brake frequently to serve stops, and traffic behind them often underestimates how quickly a fully loaded bus can decelerate. Following too closely increases the risk of rear-end collisions, and abrupt braking by other vehicles can cause secondary collisions.
Re-entry and merging incidents are also common. After a stop, the bus must merge back into the lane. When drivers accelerate to pass or hesitate near the bus’s rear quarter, conflicts can develop around signaling, spacing, and timing.
Visibility plays a role across all of these patterns. The physical footprint of a bus creates sight-line challenges for both the operator and surrounding drivers. Smaller vehicles can disappear along the bus’s sides, and drivers behind the bus often have limited forward visibility, which reduces reaction time when conditions change.
For pickup and SUV drivers, the main takeaway is exposure through proximity. Many incidents involve more than two vehicles, and being near a bus at the wrong moment can place a driver into the impact chain even without direct contact at the start.
How Fault Is Determined in Transit Vehicle Collisions
Bus crashes often involve a more structured review process than typical private-vehicle collisions. Alongside standard police documentation, transit systems commonly have internal procedures that examine operator behavior, route conditions, and compliance with operational rules. This may include reviewing onboard video, radio logs, and incident documentation associated with stops and schedules.
Fault evaluation in these cases frequently focuses on practical questions:
- Was the bus operating within lane boundaries during a turn or merge?
- Did the bus stop in a designated area, or did the stop occur unexpectedly in traffic?
- Were signals used clearly and early enough for surrounding traffic to respond?
- Did another driver fail to maintain a safe following distance or misread right-of-way?
Multi-vehicle incidents further complicate this, as investigators may need to identify the initial harmful event and then assign proportional responsibility for subsequent impacts. When passengers are involved, the need for clear reconstruction increases because a single collision can give rise to multiple injury claims.
For a broader context on how bus and large-vehicle crashes are tracked and summarized at scale, the annual bus crash fact report is a useful reference for the outcomes and categories that recur in official reporting.
Liability Complexities When Heavy Transit Vehicles Are Involved
Even after the immediate fault is assessed, transit-related crashes can introduce additional layers that affect how claims unfold.
One complexity is the mix of contributing factors that show up in investigations. Reporting may examine roadway design, stop placement, traffic signal timing, and maintenance history alongside human decision-making. That matters because responsibility can be influenced by more than the final maneuver captured at the moment of impact.
Another is process. Incidents related to public transit operations may entail distinct administrative requirements and timelines that shape how quickly a claim progresses and which documentation becomes central. Multi-party claims introduce friction because they involve multiple insurers, multiple injury reports, and conflicting narratives regarding sequence and spacing.
Crash-reporting patterns underscore the importance of documentation in these scenarios. Photos, witness contact details, and objective footage can help clarify lane position, signal timing, and the moment a chain reaction begins.
What Drivers Can Do to Reduce Risk and Protect Themselves
The collision patterns in the statistics indicate practical habits that reduce exposure to heavy transit vehicles.
Increase the following distance. Frequent bus stops create repeated braking events. More space improves reaction time and reduces the odds of becoming the first rear-end impact in a chain.
Treat bus turns as space-taking events. If a bus is approaching an intersection and likely to turn, avoid lingering beside it. Give it room to complete the turn before advancing.
Anticipate re-entry after stops. Scan ahead for bus stop zones and expect the bus to merge back into the lane. Adjust speed early instead of making last-second moves.
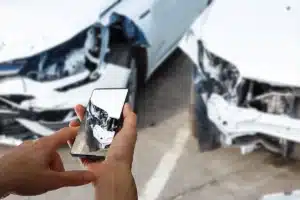
Use documentation tools. A dash camera can be helpful in incidents where timing, signaling, or lane position is disputed. Clear evidence can reduce confusion in multi-vehicle sequences.
For drivers seeking a practical refresher on defensive driving habits applicable to large-vehicle environments, this collision-prevention guide covers core positioning and awareness techniques that align with findings from bus-crash data.
The Bigger Picture Behind the Numbers
City bus crash statistics offer a clear view of where risk concentrates: intersections, curbside stop zones, merges, and compressed traffic flow. They also show how quickly a routine transit maneuver can turn into a multi-vehicle event when spacing, visibility, or timing breaks down.
For drivers sharing the road with heavy transit vehicles, the most useful value of the data is pattern recognition. When you know what types of crashes occur most often and where they tend to happen, you can drive with better spacing, smarter positioning, and fewer surprise decisions in the moments that matter most.

